Pages

USDMXN falls on Trump's "something dramatic" with Mexico

lundi 23 juillet 2018
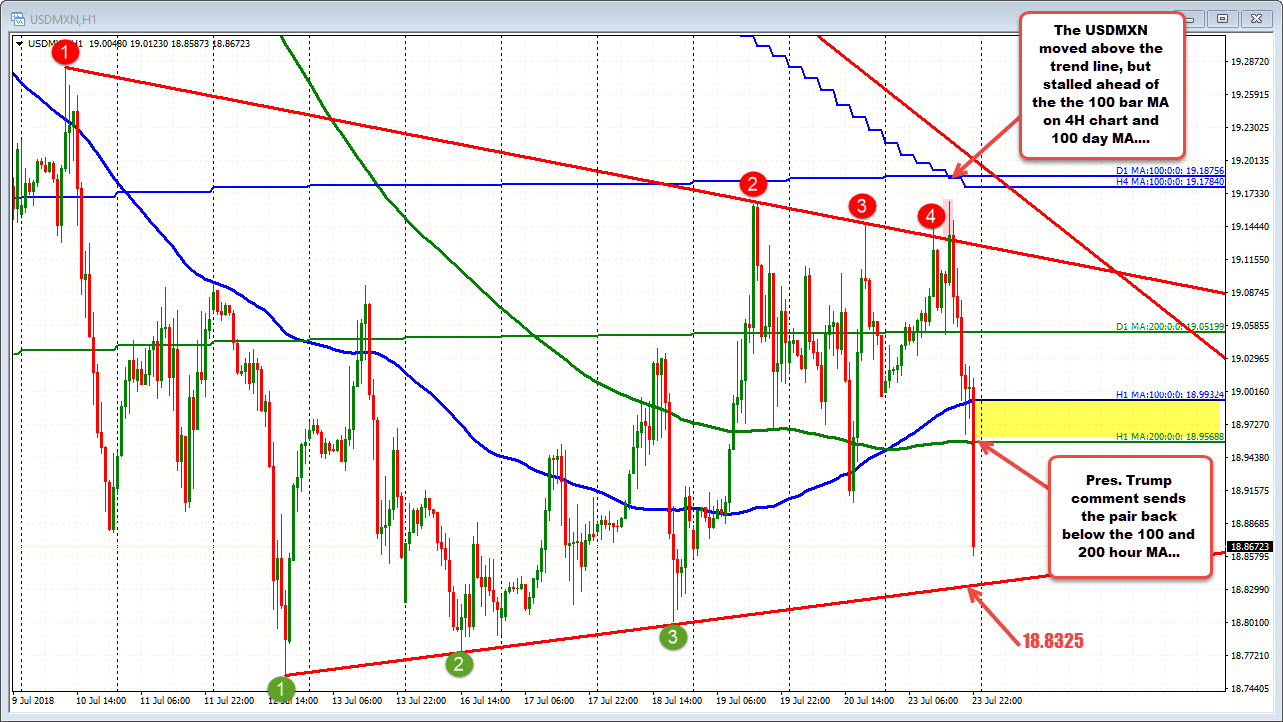
The President Trump is hosting a "Made in America" day at the White House and in his comments, he said that his administration is talking with Mexico on "something dramatic".

That has helped to push the USDMXN to new session lows and below the 100 and 200 hour MAs. Those MAs are now risk levels for shorts. The next target comes in at 18.8325

In the same position we have CADMXN where what is a dollar worth in mexico now rate is 14.32555 and those MAs are now risk levels for shorts


USDMXN falls on Trump's "something dramatic" with Mexico
Read more ...

USD: Good Luck Mr. Powell

lundi 23 juillet 2018
The market focus turns to Fed Chair Jay Powell’s semi-annual testimony to the Senate today. We identify three contentious topics that he may face in the Q&A portion.

USD: Flat yield curve is a warning sign for the Fed
Markets will turn their attention to Fed Chair Jay Powell’s semi-annual testimony to the Senate today – and while Powell will likely stick to the script in his opening remarks, we identify three contentious topics that he may face in the Q&A portion:

How will the Fed deal with an escalation in the global trade war? We have been mystified as to why markets haven’t acknowledged the US economic risks to a brewing trade war but there are signs that the tide may be turning (and the US dollar is a pretty good gauge for this). The Fed’s policy outlook currently does not take into account a possible trade war – and we don’t feel that this is a valid assumption. It may be remiss for Powell not to talk about the risks.
Will the Fed seek to avoid an inverted US yield curve? As FOMC member Neel Kashkari discussed in a recent op-ed, the argument that the low term premium may be overstating the current flatness of the US yield curve was the same argument used in 2006 – ahead of the Great Financial Crisis. The Fed must tread with caution here as it’s clear that bond investors don’t buy into the central bank’s rosy outlook for the US economy (but of course no central bank will ever explicitly forecast a recession). Chair Powell opening up to the possibility of a tightening hiatus if the curve were to further flatten towards zero would certainly help to stem any policy mistake fears – giving a welcome boost to risky assets while taking away support for the dollar.

Is the Fed’s independence at risk? This will most likely be a question posed by a Democrat senator looking to ‘get one up’ on the US administration. As Powell noted last week, there is nothing giving him concern about the central bank’s independence. Still, policy-related comments by Larry Kudlow – the head of the NEC and the president’s chief economic adviser – may just have given the Democrats some fuel to start a potential fire with today.
Bottom line: It’ll be a tricky day at the office for Powell – but given the external challenges facing the US economy, it’s hard not to see a more cautious policy being struck today. This will come as a dovish surprise to markets. A quiet day in Europe, means EUR/USD's focus will be on Powell (we look for 1.17 to hold).

GBP: Unfazed by the political mess in Westminster
The UK government narrowly avoided defeat in the Commons over the Cross-border Trade Bill after accepting the euro-skeptic ERG’s hard-line amendments that effectively render PM Theresa May’s Chequers agreement as null. Yet, whether it’s Brexit fatigue or general confusion (and we wouldn’t blame investors here), GBP still remains unfazed by the political mess taking place in Westminster. In part, markets have learnt to focus on the economic data – and a solid UK jobs report today could keep GBP/USD supported above 1.3250 (EUR/GBP below 0.8850).

NZD: Positive inflation surprise makes the case for tactical outperformance
The New Zealand dollar jumped overnight after the central bank's core inflation measure (sectoral factor model) moved up to 1.7% year on year in 2Q18. The positive inflation surprise coupled with a flat NZD OIS curve, short NZD/USD speculative positioning at five-year lows, signs that the USD may be turning lower and a potential pause in trade war risks means that we see short-term NZD outperformance. We prefer tactical long positions against AUD and aus vs new zealand (both more vulnerable to US trade policy).


USD: Good Luck Mr. Powell
Read more ...

Use of signals in MT5

lundi 23 juillet 2018
Any User who has an MQL5.community account can become a Signals Provider. A fee-based subscription can only be set up after a successful registration as a Seller.The Administration checks the Seller's identity documents. Usually 10 working days are given for checking a User's application to register as a Seller, however the check can be completed sooner.

In case discrepancies or errors are detected during the check, an application is rejected by the Administration with a reason for rejection specified. All payments shall be made in the MQL5.com internal payment system, hereinafter called the Payment System. The Payment system account is created automatically for every MQL5.community user upon registration on MQL5.com

The use of signals in mt5 trading platform is provided by the majority of forex brokers such as Alpari.com a way to help investors to obtain greater benefits with the participation of more profits. The signal provider receives a market commission for the dividends of the investors. Everyone wins.


Use of signals in MT5
Read more ...

Bitcoin (BTC) Daily Price Forecast – July 23

lundi 23 juillet 2018
BTC/USD Medium-term Trend: Bullish


Resistance levels: $7,800, $7,900, $8,000
Support levels: $7,400, $7,300, $7,200

Last week, the price Bitcoin was in a bullish trend and it reached the high of $7,313.14. Thereafter the cryptocurrency went into a sideways movement and later fell to the low of $7,230.93. On Saturday, July 21st, the price of Bitcoin had another bullish movement that took price to the high of $7,407.54.

However, the MACD line and the signal line are above the zero line which indicates a buy signal. Also, the price of Bitcoin is above the 12-day EMA and the 26-day EMA which indicates that the bullish trend is ongoing. The relative strength index period 14 is level 75 which indicates that the market is overbought suggesting bears to take control of the market. Price of Bitcoin will reach the high of $10,000 but will face resistance at the $9,000 price level.


BTC/USD Short-term Trend: Bullish

On the 1-hour chart, the price of Bitcoin is in a bullish trend. On July 23, the price of Bitcoin fell to the low $7,363.29. The MACD line and the signal line are above the zero line which indicates a buy signal. Nevertheless, the price of Bitcoin is above the exponential moving averages which indicate that Bitcoin price is rising.


The views and opinions expressed here do not reflect that of BitcoinExchangeGuide.com and do not constitute financial advice. Always do your own research.


Bitcoin (BTC) Daily Price Forecast – July 23
Read more ...

GOLD: Rejects Lower Prices, Eyes More Upside

dimanche 22 juillet 2018
GOLD: The commodity looks to strengthen further after rejecting lower prices the past week. On the downside, support comes in at the 1,220.00 level where a break will turn attention to the 1,210.00 level. Further down, a cut through here will open the door for a move lower towards the 1,200.00 level. Below here if seen could trigger further downside pressure targeting the 1,190.00 level. Conversely, resistance resides at the 1,240.00 level where a break will aim at the 1,250.00 level. A turn above there will expose the 1,260.00 level. Further out, resistance stands at the 1,270.00 level. All in all, GOLD looks to strengthen further.


Attached Images


GOLD: Rejects Lower Prices, Eyes More Upside
Read more ...

Daily Signals of Forex

dimanche 22 juillet 2018
Daily 4-5 Signals

Daily Gain 200+ Pips

Weekly Gain 700+ Pips

Monthly Gain 3000+ Pips


Free trade
Sl ,Tp, entry


https://t.me/INCForexsignalsPro


Daily Signals of Forex
Read more ...

Weekly Trading Forecasts for Major Pairs (July 23 - 27, 2018)

dimanche 22 juillet 2018
Here’s the market outlook for the week:

EURUSD
Dominant bias: Neutral
Price made a bullish attempt on Monday, but started coming down afterwards. The support line at 1.1600 was tested and price bounced off it, closing above another support line at 1.1700. The market is neutral, and that status will continue as long as price oscillates between the support line at 1.1550 and the resistance line at 1.1800. However, the neutrality in the market will soon end, and ensuing movement could most probably favor bulls. This means a break above the resistance line at 1.1800 is possible before the end of the week.

USDCHF
Dominant bias: Neutral
This pair also went downwards at the beginning of last week, and then rallied around the middle of the week, only to come downward again at the end of the week. Price closed below the resistance level at 0.9950, threatening to go further downwards. The bias on the market is eventually neutral, and it would remain so until the support level at 0.9850 is breached to the downside. The most probable direction is southwards.

GBPUSD
Dominant bias: Bearish
GBPUSD is a weak trading instrument. Since April 14, price has been going downwards. Price moved briefly below the accumulation territory at 1.3000, and then rallied by 170 pips, almost reaching the distribution territory at 1.3150. The bias remains essentially bearish (but perpetual bullish effort could threaten the bearish bias). There are additional distribution territories 1.3200, 1.3250 and 1.3300.

USDJPY
Dominant bias: Bullish
After testing the supply level at 113.00 several times, a bearish correction was started, which made the price close below the supply level at 111.50 on July 20 (a drop of 150 pips). The bias is bullish in the long-term, but going bearish in the short-term. Things will go completely bearish when price moves further downwards by another 200 pips, reaching the demand levels at 111.00, 110.50 and 110.00, and going further downwards.

EURJPY
Dominant bias: Bullish
The market had been going upwards since June 28 until recently. The recent bias is bullish but there is a high possibility of price going bearish. Price has made a bearish U-turn, after almost reaching the supply zone at 132.00. It is expected that price will continue to go downwards this week, thereby rendering the recent bullish bias invalid and reaching the demand zones at 130.00, 129.50 and 129.00. Those demand zones may even be exceeded before the end of July.

GBPJPY
Dominant bias: Bearish
There is a Bearish Confirmation Pattern in the market, as a result of a drop of 300 pips last week. The drop has already generated a bearish signal in the market, brought about by the perceived weakness in GBP, and the strength in JPY. This week (even till the end of July), the outlook on JPY pairs is bearish, and that means GBPJPY also will experience further bearish movement, which would enable it to reach the demand zones at 145.50, 140.00 and 135.50.


This forecast is concluded with the quote below:

“A surprising insight for me in Jack Schwager’s Market Wizards was that most of the top traders he interviewed are 1-trick ponies: they do one thing — and they do it very well. Their success was built upon their ability to discover what others overlooked. I concluded that ‘doing one thing well’ would immediately simplify my trading life and could eventually evolve one thing into an important trading edge.” – VTI

Source: www.tallinex.com


Weekly Trading Forecasts for Major Pairs (July 23 - 27, 2018)
Read more ...