Pages

Spread

mardi 29 mai 2018
The trading spreads can affect the result of our trading with certainly, that’s why when choosing a broker we have to ensure the flexible trading spreads for leading a comfortable trading life with certainly, from my first day of trading I have been using LQDFX because of their flexible trading spreads from 0 pips which is very supportive to predict the real faction of this market with certainly when use ay kinds of trading techniques with scalping. so, my trading life is very much comfortable.


Spread
Read more ...

Bitcoin Long-term Price Analysis

lundi 28 mai 2018
BTCUSD Long-term Trend – Bearish


Distribution territories: $11,000.00, $12,000.00, $13,000.00.
Accumulation territories: $6,000.00, $5,000.00, $4,000.00.


Bitcoin has been continuously witnessing a downward slide against the US dollar this week. The last time that the pair made a slight high was on May 20. The bears have had a greater advantage on the market over the bulls over the past few weeks. The major critical territory the pair is believed not to easily break remains the immediate accumulation territory of $6,000.00. The cryptocurrency’s price only touched it on February 6.

The 13-day SMA has briefly crossed the 50-day SMA. Both moving averages are a bit above the distribution territory of $8,000.00, whilst price is currently averaging towards the accumulation territory of $7,000.00.

The Stochastic Oscillators have breached past range 20 in the oversold zone suggesting the bearish trend is soon going to end. The market behavior is still expected to see the bears push harder than the bulls. Current possible foundational territories within which strong catalysts can be obtained for a bullish reversal are the accumulation territories of $6,000.00 and $4,000.00.

Investors can probably lookout for a reversal from the bearish movement to go in, but traders can possibly watch out for a sudden breakout of either the accumulation territory of $7,000.00 or distribution territory of $8,000.00 to join in the direction of the breakout trend with the use of fund management rules.


The views and opinions expressed here do not reflect that of CryptoGlobe.com and do not constitute financial advice. Always do your own research.

SOURCE: https://www.cryptoglobe.com/markets/price-analysis


Bitcoin Long-term Price Analysis
Read more ...

Weekly Trading Forecasts for Major Pairs (May 28 – June 1, 2018)

dimanche 27 mai 2018
Here’s the market outlook for the week:

EURUSD
Dominant bias: Bearish
There is a very strong Bearish Confirmation Pattern on EURUSD. Price went southwards by 100 pips last week (it has gone south by almost 750 pips since April 19). The line at 1.1650 has been tested and breached to the downside, slightly. This week, further bearish movement is a possibility, and the support lines at 1.1600 and 1.1550 can be reached as well. However, there is also a possibility of a bullish reversal before the end of the week.

USDCHF
Dominant bias: Bullish
This trading instrument is bullish in the long-term, and bearish in the short-term. Last week, price turned southwards, testing the level at 0.9900 several times and eventually closing below it on Friday. One reason why the market became bearish in the short-term is the strength in CHF. CHF still strong, as evident on major CHF pairs. The market can thus reach the support levels at 0.9850 and 0.9800, thereby erasing the long-term bullish outlook on the market.


GBPUSD
Dominant bias: Bearish
This pair went southwards last week, closing below distribution territory at 1.3300 on Friday. Price shed almost 170 pips last week, and it has shed 1,050 pips since April 17 (an ideal market condition for trend followers). The GBP remains very week, and it is not advisable to seek long trades here, except to go short on rallies. The market is expected to lose at least, additional 150 pips this week, reaching the accumulation territory at 1.3150.
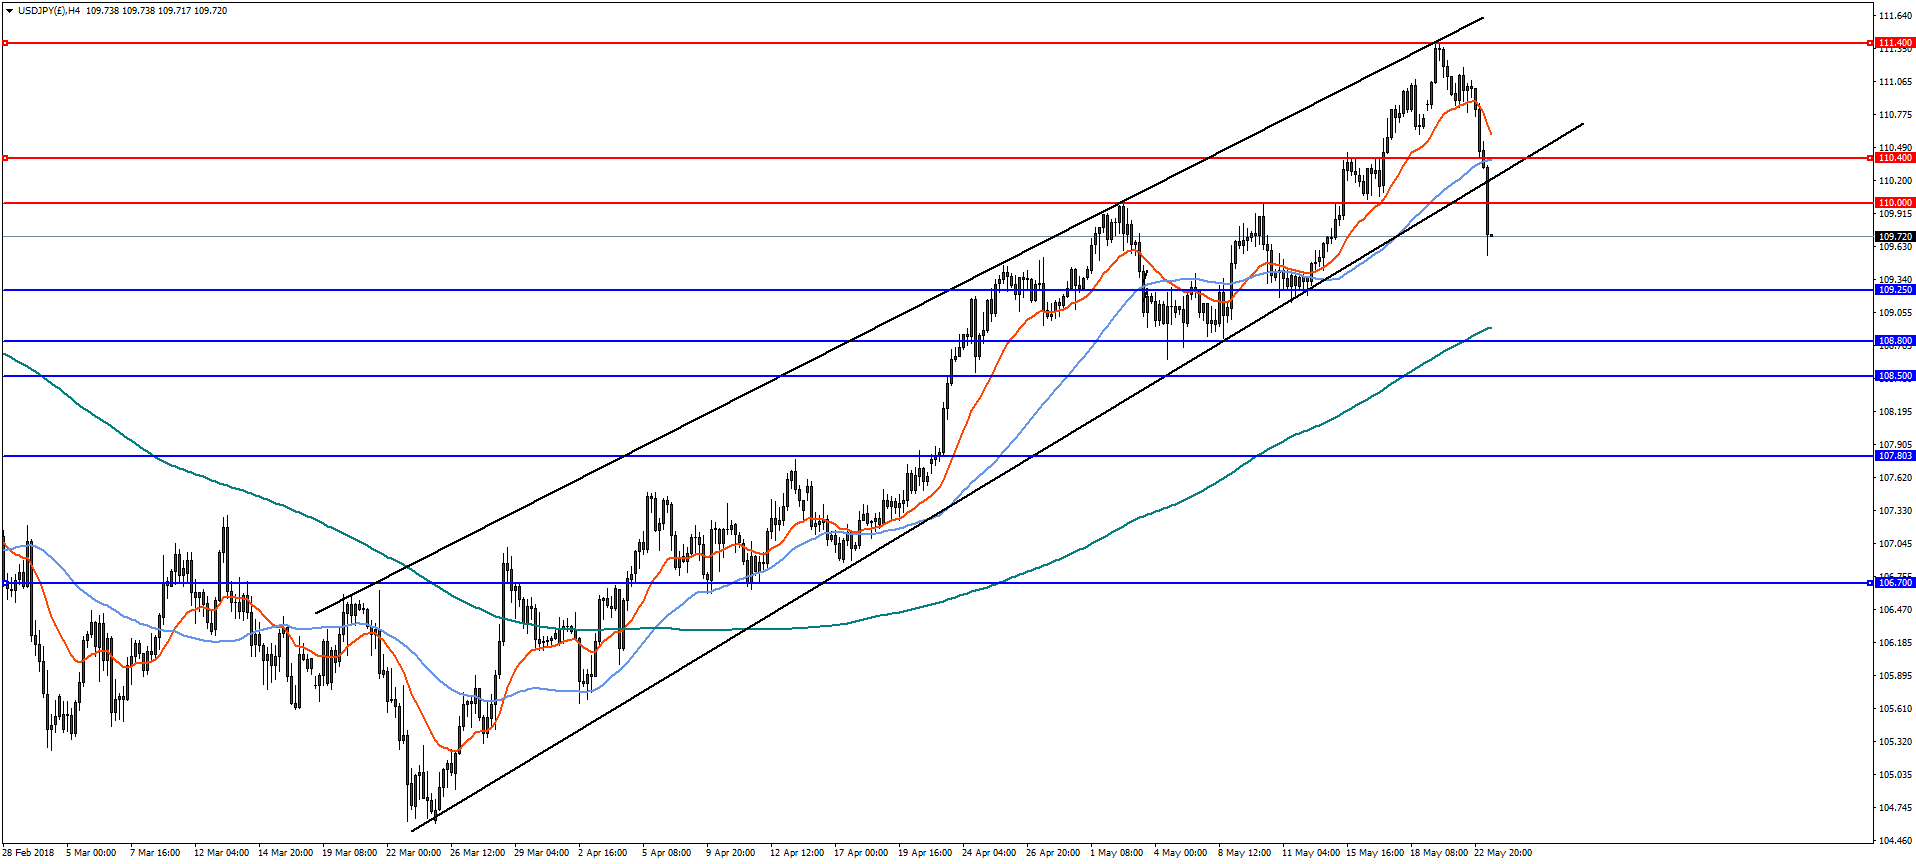
USDJPY
Dominant bias: Bullish
The trend is also bearish in the short-term, but bullish in the long-term. From the high of last week, price went downwards by 230 pips, to test the demand level at 109.00, closing above it on May 25. Further bearish movement is expected this week, and this may affect the long-term bullish bias, as the demand levels at 109.00, 108.50 and 108.00 are aimed, for there is a considerable stamina in Yen.


EURJPY
Dominant bias: Bearish
The downwards movement that happened last week has put an end to the recent sideways movement that was seen in the market. From May 9 to 22, the market consolidated in the context of a downtrend, and at last, there was a breakout in favor of sellers. This has really put more emphasis on the Bearish Confirmation Pattern in the market, coupled with the weakness in EUR. This week, the demand zones at 127.00, 126.50 and 126.00 may be reached.


GBPJPY
Dominant bias: Bearish
The bias on GBPJPY is bearish and it should continue to be bearish. GBP is weak and JPY is strong. Besides, there was a huge drop of over 450 pips last week, slashing more and more demand zones as bears rejoiced. Since April 17, more than 800 pips have been shed, and this just seems to be the beginning, as stronger bearishness is anticipated. At least, another 200 pips would be shed this week.

This forecast is concluded with the quote below:

“…Trading appeals to so many of us. It generates a sense of freedom – a notion that we can do it from anywhere at anytime. The engagement with the market is at our own timing and on our own terms. We can in essence wander in and out whenever we want. Our movement is not at the behest of someone else and it not set according to their timetable. The nomad in us is fulfilled as a trader.” – Chris Tate

Source: www.tallinex.com


Weekly Trading Forecasts for Major Pairs (May 28 – June 1, 2018)
Read more ...

USD/JPY has broken channel support and a close below 110.00

mercredi 23 mai 2018
The Japanese Yen (JPY) is benefiting from risk-off sentiment today with the USD/JPY pair plunging below the 110.00 level. A number of factors are combining to trigger the move including geopolitical tensions in Iran, trade war rhetoric between US and China, political turmoil in Italy, and renewed concerns over North Korea. The US 10-year Treasury yields have also dropped sharply to 3.015%. The focus for today will be the release of latest FOMC meeting minutes, which may give clues to the central bank’s near-term monetary policy outlook. If the text reinforces the expectations for three rate hikes for 2018, the US Dollar may continue to strengthen.

USD/JPY

On the 4-hourly chart, yen to usd has broken channel support and a close below 110.00 opens the way to further declines towards the 38.2% retracement at 108.80 with support at 109.25. A break of 108.80 could see a deeper retracement to the 107.00 handle. A bullish reversal and break of 110.40 is needed to resume the uptrend to the highs at 111.40, now 1 jpy to usd at 0.00908.


USD/JPY has broken channel support and a close below 110.00
Read more ...

Currencies Slips On Trump Comment Over China

mercredi 23 mai 2018
The Canadian dollar has posted considerable losses in the Wednesday session. Currently, canadian dollar to usd is trading at 1.2906, up 0.68% on the day. On the release front, there are no Canadian releases on the schedule. In the US, the key event is the Federal Reserve minutes from the May policy meeting. On Thursday, the US will release unemployment claims and Existing Home Sales.

On Tuesday, US President Donald Trump sounded skeptical over progress in trade talks between the US and China, saying he was ‘not really’ satisfied with the negotiations. Trump’s comments have confused the markets, as Treasury Secretary Steven Mnuchin declared on the weekend that the trade spat was ‘on hold’. The result? Asian and European stock markets are seeing red in the Wednesday session, as is the Canadian dollar. Investor risk appetite has also waned as there is uncertainty whether North Korean leader Kim Jong-un will meet with President Trump next month. On Tuesday, Trump acknowledged that there was a ‘substantial’ chance that the summit planned with Kim in Singapore on June 12 would not take place.

The Federal Reserve will be in the spotlight on Wednesday, as analysts pore over the minutes of the May policy meeting. The Fed did not raise rates at the meeting, but a strong US economy has raised expectations that the Fed will press the rate trigger in June – according to the CME Group, the odds of a June hike stand at 100%. The markets will be looking for some guidance from the May minutes, and if the message from Fed policymakers is hawkish, traders can expect the US dollar to post gains. On Monday, Atlanta Fed President Raphael Bostic sounded positive about the economy, saying the Fed’s employment and inflation goals were close to being met. The Fed expects growth to be around 2.5% in 2018, and inflation has been moving closer to the Fed target of 2.0%


Currencies Slips On Trump Comment Over China
Read more ...

Mexican peso recovers strength after a weak start

mercredi 23 mai 2018
Mexican peso recovers strength after a weak start..
USD/MXN traded above 20.00 for the first time in 14 months before retreating
The Mexican peso managed to erase daily losses after falling to the lowest level since February 2017 against the US Dollar. USD/MXN rose to 20.03 earlier today but it was rejected from above 20.00 and pulled back.

It continued to correct lower during the American session and recently printed a fresh daily low at 19.86. Higher crude oil prices, an improvement among Latin American currencies (excluding Venezuela) and less pessimism about a not too soon NAFTA deal, supported the recovery of the Mexican peso.

“Mexico reports mid-May CPI Thursday, which is expected to rise 4.4% y/y vs. 4.69% in mid-April. If so, inflation would still be above the 2-4% target range. Next Banxico meeting is June21 and much will depend on how the peso is trading ahead of July elections. April trade and Q1 current account data will be reported Friday”, explained analysts at BBH about upcoming events from Mexico. In the US the key event of the week will be FOMC minutes on Wednesday.

Technical levels USDMXN

The area around 19.90/20.00 continues to be the key resistance. A daily close con top could open the doors to more gains with potential targets at 20.15 and 20.30.

On the flip side, while below 19.90 pesos to dollars could correct further. Support levels area seen at 19.70 and 19.50/55.


Mexican peso recovers strength after a weak start
Read more ...

Weekly Trading Forecasts for Major Pairs (May 21 - 25, 2018)

dimanche 20 mai 2018
Here’s the market outlook for the week:

EURUSD
Dominant bias: Bearish
This pair trended downwards last week, testing the support line at 1.1750. The market went essentially sideways on Thursday and Friday, and may go below the support line at 1.1750, to target another support line at 1.1700. About 250 pips have been lost this month, and it just seems to be the beginning. The outlook on EUR pairs is bearish for this week (EUR would be seen going downwards versus major currencies).


USDCHF
Dominant bias: Bullish
This trading instrument is bullish in the long-term, but neutral in the short-term. Price has been consolidating in the past two weeks; whereas that is not strong enough to render the recent bullish bias useless. There is going to be a breakout at last, but the movement to the upside will no longer be a serious thing. While USDCHF is supposed to go upwards, there would be a challenge to the upwards move, because CHF is expected to gain serious stamina this week (major currencies will drop versus it). This means that the coming strength in CHF may hinder USDCHF from getting seriously pushed further northwards.

GBPUSD
Dominant bias: Bearish
The Cable is bearish in the long-term, but neutral in the short-term. The bearish movement that started last month, has continued this month (although price has been ranging in the short-term). There remains a valid Bearish Confirmation Pattern in the market, despite the fact that it has been ranging in the last two weeks. A breakout is imminent, which would most probably favor bears. The accumulation territories at 1.3450, 1.3400 and 1.3350 could be reached thus week.
.
USDJPY
Dominant bias: Bullish
The bullish movement that was witnessed last week has saved the ongoing bullish bias in the market. The bullish movement started in March 2018 and it has held out till now. The supply level at 111.00 was tested before price closed below it on Friday. This week, there is a high probability that the market would continue going upwards, reaching the supply levels at 111.00, 111.50 and 112.00.


EURJPY
Dominant bias: Bearish
The bias on this cross is bearish, but it is a precarious bias. What the market did last week was a zigzag movement without a clear directional propensity. Price moved upwards, downwards, and upwards again, within the supply zone at 131.50 and the demand zone at 129.50. A 200 –pip movement to the upside or to the downside would easily change the bias to bullish or bearish, and that is exactly what is expected this week.


GBPJPY
Dominant bias: Bullish
The market is bullish, at least, in the very short-term. The current bullishness (which is not very strong), started on May 8, and it has been dragged on in spite of constant interferences from bears. Price succeeded in moving further northwards last week, almost reaching the supply zone at 150.00, before closing below it on May 18. This week, too much weakness in GBP could frustrate a clean bullish movement. Nevertheless, the supply zone at 150.00, might once again, be breached.

This forecast is concluded with the quote below:

“According to Kermit the Frog, it’s not easy being green. For skillful traders, it’s not hard to be green. May your trades be green.” – attributed


Source: www.tallinex.com


Weekly Trading Forecasts for Major Pairs (May 21 - 25, 2018)
Read more ...

Smart ways to trade the Forex market

jeudi 17 mai 2018
Making money in the online trading industry is very hard. Those who are relatively new to the Forex market might say leading your dream life based on currency trading profession is not possible. But look at the experienced traders in the United Kingdom. You will be surprised to see their portfolio. Since most of the professional brokers are offering high leverage trading accounts to the retail traders, making money even with a small investment is very much possible. But to become a profitable trader you must learn the proper art of currency trading. You can’t make any real progress unless you know about the market dynamics. The expert traders are always one step ahead and they know the perfect way to trade the market. Today we will give you some amazing tips which will help you to become a better trader within a very short period of time.

Do the fundamental analysis
Fundamental analysis is very crucial to your success. Majority of the new traders don’t know the importance of fundamental analysis. They always trade the market by using the technical analysis. Technical analysis will only give you the perfect entry point for the market but this will never give you a clear clue regarding the strength of the market trend. This is where you need to do fundamental analysis. If you can learn fundamental analysis properly you can easily assess the strength of the market trend. Even it will help you to ride the long-term market trend with a high level of accuracy. Some of you might say understanding the fundamental factors of the market is very hard but in reality, this is very easy. You don’t have to get a master degree in economics to become understand this sector.

Trade with discipline
This is the most common topics every novice traders come across in the starting of their career. But sadly very few traders trade the market with discipline. If you consider the expert traders in the options trading industry, you will be surprised to see their strong discipline. Regardless of the outcome of the trade, they are always trading the market with managed risk. Even after losing more than ten trades they are still comfortable. You have to gain complete control over your emotions to deal with the complex price movement of the financial instrument. If you ever trade the market with emotions, you are going to lose a significant portion of your investment. So how do you control your emotions? You need to have a clear understanding of the investment industry to gain control over your emotions. And for this, you must work hard and invest some money in some paid trading course.

Avoid using the indicators
Indicators are often considered as a waste of time. You can never find the best trades unless you know the proper way to trade the key support and resistance level. Instead of using the indicators, try to use the price action confirmation signal. Price action trading strategy will help you to trade the key support and resistance level with the high level of accuracy. But learning the price action trading system will require hard work. You have to memorize all the reliable price action confirmation signal to trade the major levels of the market. You can also use one or two indicators to filter the best trades but never rely on the indicators readings only.

Use a trading journal
The use of a trading journal is a must to become a profitable trader. It will help you to assess your losing trades during the weekend. Prior to the execution of your trade, you must write down the key reasons for which you are risking a certain portion of your account balance. If you can develop this habit you will never over trade the market. Most importantly it will make you an expert trader.


Smart ways to trade the Forex market
Read more ...

Bitcoin Price Analysis – May 16

mercredi 16 mai 2018
BTCUSD Medium-term Trend: Bearish


Resistance: $8,500, $8,400, $8,300
Support: $7,900, $8,000, $8,100

Yesterday, May 15, the BTCUSD pair traded above the $8,500 price level and, at the same time, the bearish trend line was broken. Secondly, the candlestick also closed on the opposite of the trend line. The price action also showed that the price retouched the trend line and began a ranged bound movement. Based of that, it was assumed that the downtrend was over.

It was previously stated that Bitcoin price is unlikely to continue its downtrend. Today, the price was trading at $8,341.68 at the time of writing. However, the weekly chart shows that it fell again to the previous day's low of $8,341.68. Nevertheless, if the asset continues its fall, it will certainly retest the previous low of $8,000.

The relative strength index period 14 is level 27 indicating that the market is oversold. This suggests that the bulls will take control of the market. However, that does not mean the price will not retest the previous low of $8,000 because it can rally even at the oversold market condition.
BTCUSD Short-term Trend: Bearish

The daily chart shows that Bitcoin price has a bearish outlook. Yesterday, the asset was trading at $8,700 in a range bound movement. Later, the price fell to $8,500 and resumed its range bound movement. Bitcoin finally fell to $8,300. Since the price has broken the $8,500 level, it may find support at $8,000.


The views and opinions expressed here do not reflect that of CryptoGlobe.com and do not constitute financial advice. Always do your own research.

SOURCE: https://www.cryptoglobe.com/markets


Bitcoin Price Analysis – May 16
Read more ...

Is the MetaTrader 4 and 5 usable on the platform youoption?

mardi 15 mai 2018
Does anyone have more information about that? Before I want to start with them, it would be nice to know! I saw something about a first deposit bonus, so I will safe it!


Is the MetaTrader 4 and 5 usable on the platform youoption?
Read more ...

Ethereum Price Analysis – May 15

mardi 15 mai 2018
ETHUSD Medium-term Trend: Ranging


Resistance: $760, $750, $740
Support: $700, $710, $720

Yesterday, May 14th the overall trend of Ethereum was bearish. The price of the asset had fallen from the highs of $830, $767 and $735 as per the bearish trend line. However, at the time of writing, the MACD line and the signal line were above the zero line indicating a buy signal. The price bars of Ethereum were above the 12-day EMA and 26-day EMA indicating that the bullish trend is ongoing.

It was assumed that if the support level was broken, Ethereum would find support at $672. Today, Ethereum is currently trading at $723.67 at the time of writing. From the weekly chart, the price of the asset is above the $700 level. The asset is ranging from the support level at $700 to the resistance level at $750. Today the indicators are showing bullish signals. The MACD line and the signal line are above the zero line indicating a buy signal.

The price bars of Ethereum were above the 12-day EMA and 26-day EMA indicating that the bullish trend is ongoing. Therefore the price is expected to test the resistance level at $750 and reach further highs.


ETHUSD Short-term trend: Ranging

On the daily chart, the price of Ethereum is in a ranging market. At the levels of $690 and $700, the price of Ethereum was ranging. Then it had a bullish movement which took it to the high of $740. At the high of $740, it resumed its range bound movement.


The views and opinions expressed here do not reflect that of CryptoGlobe.com and do not constitute financial advice. Always do your own research.

SOURCE: https://www.cryptoglobe.com/markets


Ethereum Price Analysis – May 15
Read more ...

Bitcoin Long-term Price Analysis

lundi 14 mai 2018
BTCUSD Long-term Trend – Bearish


Distribution territories: $11,000.00, $12,000.00, $13,000.00.
Accumulation territories: $7,000.00, $6,000.00, $5,000.00.

Bitcoin has been consecutively witnessing bearish movements against the US dollar since the beginning of this week. Between May 5 and 6, the bulls were close to the distribution territory of $10,000.00 but were being slightly weakened, and the bears eventually took over. The 13-day SMA is still above the 50-day SMA.

Bitcoin’s price is currently trending southward towards the 50-day SMA within the distribution territory of $10,000.00 and the accumulation distribution territory of $8,000.00.

The Stochastic Oscillators have crossed and moved a bit southward past range 50. They are seemingly gathering momentum around said range. Expectations may see the current bearish movement lure traders into entering fake selling orders that will only last for a while.

The bulls can be believed to have started building up the required catalyst from the markets current down trend. The sentiment as to what investors are expected to do show us they can continue to enter long trades from bearish reversal trends. Traders can also look out for the same reversal format and take long entries by applying good money management rules


Views and opinions expressed here do not reflect that of CryptoGlobe.com and do not constitute financial advice. Always do your own research.

SOURCE: https://www.cryptoglobe.com/markets


Bitcoin Long-term Price Analysis
Read more ...

Some Timely Trading Jokes

samedi 12 mai 2018
A little bit of humor to get your Friday off to a chuckle:

Chart - what you check after you exit trading, trying to understand what went wrong.

Day Trading - trading which you start too late or exit too early.

Margin - (if you are up) a safe situation with huge potential return (if you are down) an evil trick by Unseen Forces that can cause you losing more money than you have.

Margin Call - what happens when your broker makes an accounting mistake.

Moving Average - a curly line that has nothing to do with price movement if you have an open position.

Position Trading - day trading that went the wrong way right after you took a position.

Trend Line - an imaginary line on the price chart that only changes when the market is closed or when you are not looking.

Source: Tradingeducators.com

www.tallinex.com wants you to be a successful trader


Some Timely Trading Jokes
Read more ...

Forex Forum

jeudi 10 mai 2018
In order to my trading understanding, I think , Forex Forum is the most useful way of Forex learning! Basically, most of the novice traders start their trading career without any trainer, so they need knowledge! In addition, there have so many pro traders in various Forex forums, and they share their analysis in forums so willingly! As a result, novice traders can improve their trading skill by using Forex forum’s! I appreciate this way of learning!


Forex Forum
Read more ...

Bitcoin Weekly Price Analysis – May 5

lundi 7 mai 2018
BTCUSD Long-term Trend – Bearish

Distribution territories: $12,000.00, $13,000.00, $14,000.00.
Accumulation territories: $8,000.00, $7,000.00, $6,000.00.

In spite of lower highs than lower lows on the BTC/USD pair, the long-term trend chart has not been able to make a significant move away from a bearish outlook. On April 29, the pair declined a bit below the accumulation territory of $9,000.00 and on May 1, it reversed northward towards the distribution territory of $10,000.00.

The bulls are currently gaining momentum as the 13-day SMA is now above the 50-day SMA.
The Stochastic Oscillators have now dipped into the overbought zone and are also consolidating their movement within it. Accumulation territories from $8,000.00 and below remain foundational territories.

As it has been observed, the market seems to be recovering from several weeks of selling pressure. The bears are getting weaker against the bulls as has already been shown by price action. It is expected that sooner than later the bulls will eventually gain the hold of the market trend.
Going by this assertion, investors can continue with long entries while the price reverses from what seemingly looks like a bearish move. While traders can look out for long entries with proper money management of either ratio 1 to 2, or 1 to 3.

The views and opinions expressed here do not reflect that of CryptoGlobe.com and do not constitute financial advice. Always do your own research.


Bitcoin Weekly Price Analysis – May 5
Read more ...

Weekly Trading Forecasts for Major Pairs (May 7 - 11, 2018)

dimanche 6 mai 2018
Here’s the market outlook for the week:

EURUSD
Dominant bias: Bearish
EURUSD went downwards by 170 pips last week. It has gone downwards by 430 pips since April 19. There is a Bearish Confirmation Pattern in the market and it is supposed to continue going lower and lower, reaching the support lines at 1.1900, 1.1850 and 1.1800. USD is supposed to continue being strengthened, and so long trades are not currently recommended, until it is clear there is a change in the market.


USDCHF
Dominant bias: Bullish
This pair has normally been going upwards as EURUSD is going downwards. Price has gained over 800 pips since February 16 (it gained 130 pips last week). The great psychological level at 1.000 has eventually been reached and a lot of activity has started around that level, as bears are struggling to prevent bulls from pushing price above the level. However, bulls will eventually win the struggle, and enable price to stay above the psychological level at 1.0000, as another resistance level at 1.0050. The USD reigns.

GBPUSD
Dominant bias: Bearish
Since testing the distribution territory at 1.4350 on April 17, Cable has nosedive, shedding 850 pips since then (including 250 pips that were shed last week). Price tested the accumulation territory at 1.3500 on Friday, but closed above it. The outlook on GBP pairs is bearish for this week, and thus Cable should continue its downwards exploration, reaching the accumulation territories at 1.3500, 1.3450 and 1.3400.

USDJPY
Dominant bias: Bullish
The bias on the market is bullish, but the trend is in a precarious position. Price did not go upwards significantly last week, neither did the bearish correction that followed help the matter. Once the supply level at 110.00 was tested, price got corrected by 100 pips, moving briefly below the demand level at 109.00 and then closing above it on Friday. Since the bullish bias is in a precarious situation, any movement below the demand level at 108.00 will result in a clear bearish signal. A movement to the downside is very much likely this week.

EURJPY
Dominant bias: Bearish
This trading instrument has dropped by 300 pips since April 26. Roughly 250 pips were shed last week, owing to the weakness in EUR and a show of energy in JPY. There is a huge Bearish Confirmation Pattern in the market, and price is expected to continue going southwards, owing to the bearish outlook on JPY pairs this week. The demand zones at 130.00, 129.50 and 129.00 would be reached.

GBPJPY
Dominant bias: Bearish
A very weak GBP has met a strong JPY, and the result was that price went out of balance, in favor of bears. There is a huge drop in the market (nearly 300 pips), as the demand zone at 147.00 was nearly tested. There is a bearish outlook on this cross, and further southwards journey is expected. There could be transitory upwards bounces in the market, but they would serve as good short-selling opportunities.

This forecast is concluded with the quote below:

“(Good) Trading happens outside your comfort zone… What I love about trading is the ongoing challenge and it makes me happy to know that I’m competing against some of the brightest minds on earth in the markets. They do what works.” - Marco Mayer


Source: www.tallinex.com


Weekly Trading Forecasts for Major Pairs (May 7 - 11, 2018)
Read more ...